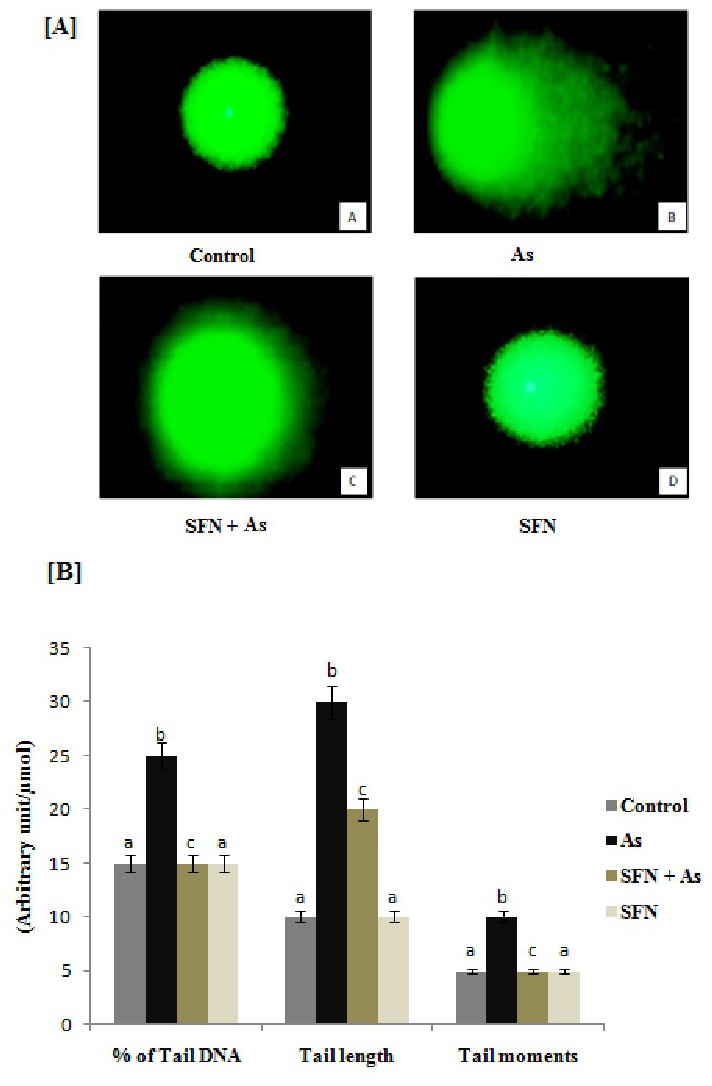
Fig. 5. (A) Representative photomicrographs of comets stained with cyber green showing the DNA migration pattern in control and experimental hepatocytes. (A) Control group shows no DNA migration. (B) As-treated group shows extensive DNA migration. (C) SFN-treated + As-intoxicated group shows minimal DNA migration. D) Sulforaphane (SFN)-treated group shows no DNA migration. (B) Effect of SFN and As on DNA damage (in terms of % tail DNA, tail length, tail moment,) in the hepatocytes of control and experimental rats. Arbitrary unit = % tail DNA × tail length. Values are expressed as mean ± SD for groups of eight rats in each. Statistical significance was determined by one way ANOVA (Duncan's Multiple Range Test). Values not sharing a common or same alphabet letter (a-f) and they differ significantly at P<0.05 (Duncan's multiple range test). Magnification ×200.